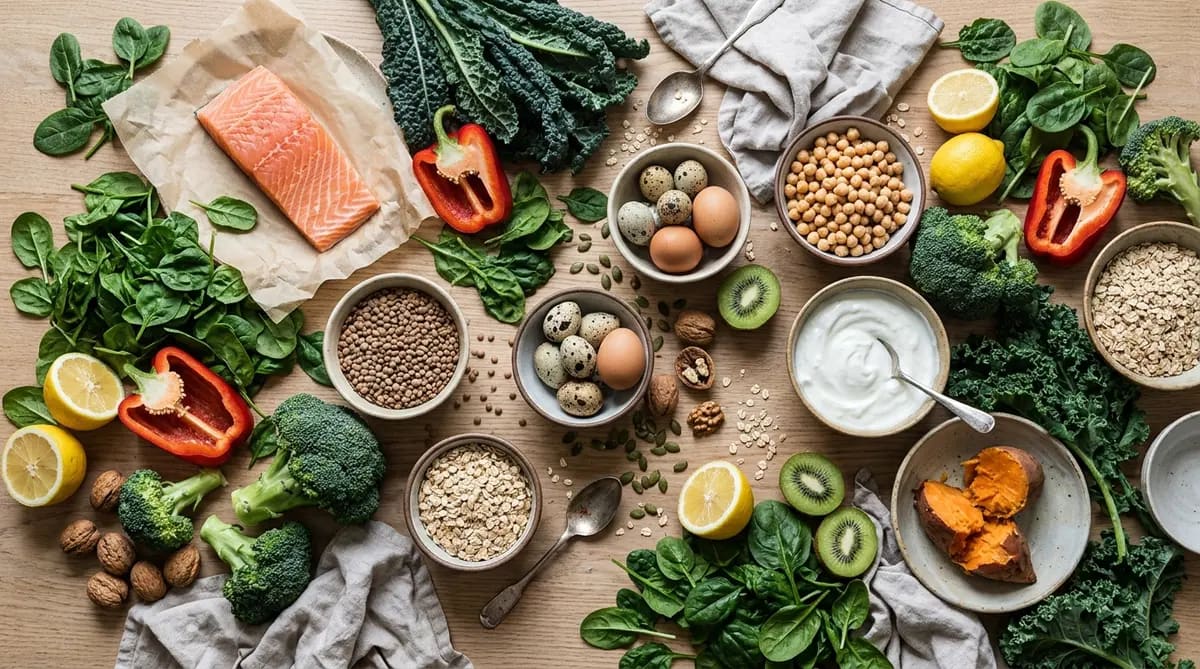
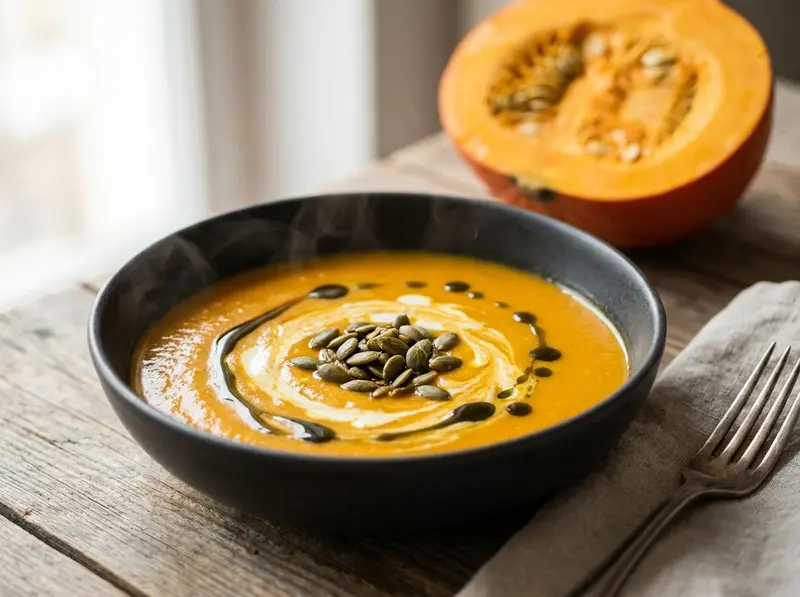
A healthy food, in the sense nutritionists use, is a nutrient-dense one: it brings a lot of vitamins, minerals, protein and fiber for its calories, and little saturated fat, sugar and salt. Spinach is the extreme case, with 23 kcal per 100 g and more than six days' worth of vitamin K by the EU reference. Cola and salami sit at the other end. Below, in tables, you will find what the main vitamins and minerals do and which everyday foods have the most of them, a ranking of 67 common foods by a published nutrient-density index, the daily reference amounts used on EU food labels, and how cooking changes what is left on the plate. Every number comes from USDA FoodData Central, the EU labeling regulation, EFSA, the WHO, the fact sheets of the US National Institutes of Health or the published NRF9.3 papers; the ranking scores are our own calculation.
What makes a food healthy?
The guidance below from the WHO and Harvard is about the whole diet, not single foods. A nutrient-dense food is simply one that gets you closer to it without extra calories. A raw red pepper gives 128 mg of vitamin C per 100 g for 26 kcal. A glazed doughnut gives 421 kcal per 100 g and very little you would miss if it were gone.
Nutrient density is also why the tables below are per 100 g, which is how food databases and EU labels count. Per 100 g, dry foods such as seeds, nuts and hard cheese look enormous, because nobody eats 100 g of parsley or pumpkin seeds at a sitting. Keep that in mind when a seed tops a list. For scale, the EU labeling regulation counts 15% of the reference value per 100 g as a significant amount of a vitamin or mineral.
What does a healthy plate look like?
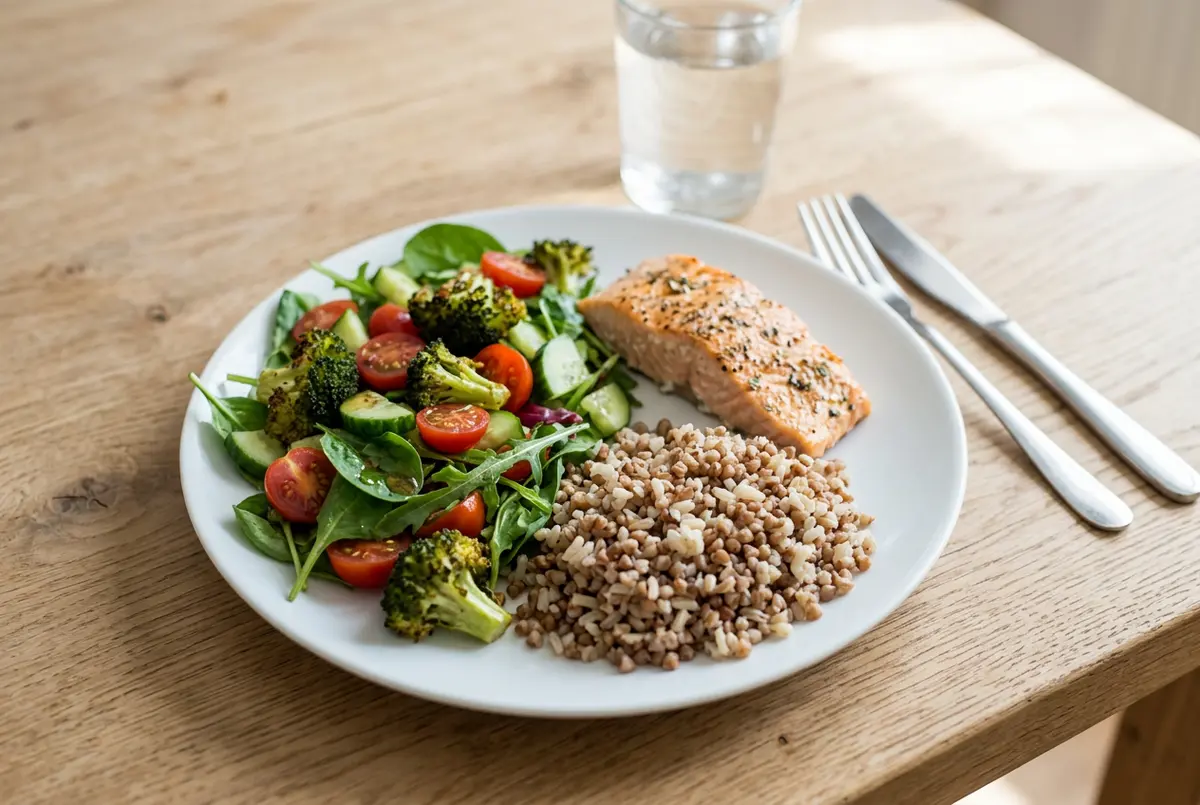
The WHO fact sheet on healthy diets, dated January 2026, puts the basics into a few numbers for adults. Eat at least 400 g of vegetables and fruit a day. Keep salt under 5 g a day, which is 2 g of sodium. Keep free sugars below 10% of energy, about 50 g on 2,000 kcal, and below 5% for further benefit. Fat should stay at or below 30% of energy and not under 15%, with saturated fat under 10% and trans fat under 1%. Carbohydrates make up roughly 45 to 75% of energy, mostly from whole grains, vegetables, fruit and pulses, and protein 10 to 15%, about 50 to 75 g a day. The WHO also asks for at least 25 g of naturally occurring fiber a day, and says that at least 3,510 mg of potassium a day may be beneficial for adults.
Harvard's Healthy Eating Plate turns this into a picture. Half the plate is vegetables and fruit, and potatoes do not count as vegetables. A quarter is whole grains. The last quarter is protein: fish, poultry, beans or nuts, less red meat, and no bacon or cold cuts. Cook with plant oils, drink water, tea or coffee, keep dairy to one or two servings a day and juice to one small glass.
Food labels in the EU use a separate set of reference intakes. They are the figures behind the percentages printed on packaging, one set of numbers for all adults.
| Nutrient (per day) | EU reference intake | WHO guidance |
|---|---|---|
| Energy | 8,400 kJ / 2,000 kcal | — |
| Fat | 70 g | ≤ 30% of energy, at least 15% |
| Saturated fat | 20 g | < 10% of energy; trans fat < 1% |
| Carbohydrate | 260 g | about 45–75% of energy |
| Sugars | 90 g (all sugars) | free sugars < 10% of energy, about 50 g at 2,000 kcal |
| Protein | 50 g | 10–15% of energy, about 50–75 g |
| Salt | 6 g | < 5 g (2 g sodium) |
| Fiber | 25 g (EFSA adequate intake) | at least 25 g |
| Water | women 2.0 L, men 2.5 L total (EFSA) | — |
Source: Regulation (EU) 1169/2011, Annex XIII Part B; EFSA Journal 2010;8(3):1462 and 1459; WHO Healthy diet fact sheet, 2026.
The EFSA water figures are total water, and about 80% of it comes from drinks and about 20% from food. EFSA adds 300 ml a day in pregnancy and 700 ml while breastfeeding.
Which foods are the healthiest?
To rank foods we used NRF9.3, the Nutrient Rich Foods index developed by Drewnowski and Fulgoni. For every 100 kcal of a food it adds up the percentage of the daily value for nine nutrients you want more of (protein, fiber, vitamins A, C and E, calcium, iron, potassium and magnesium), with each one capped at 100%. Then it subtracts the percentage of the daily maximum for three you want less of: saturated fat, added sugar and sodium. A high score means a lot of nutrition per calorie and little to limit. We used the reference values from Drewnowski's 2026 paper in Foods, which are US daily values, and nutrient data for 67 foods from USDA FoodData Central.
The index has real limits, and they explain most of the surprises. Because it counts per 100 kcal, low-calorie greens almost always beat nuts, fish and cheese, even though per serving the nuts give more. It uses US daily values, not EU ones. It ignores omega-3 fats, polyphenols, protein quality and absorption, so the calcium in spinach (which the body barely absorbs, see below) counts in full. USDA has no added-sugar figure, so whole foods were scored with zero and sweet or processed foods with their total sugar, which can make their penalty too big. Where USDA lacks vitamin E or A, that term is left out, so firm tofu (no A or E data) and chia seeds (no A data) score lower than they should. And salted potato chips (23.7) and enriched white bread (12) score above cheddar (7.1) and white rice (9.3), which tells you more about the index than about chips. One more fact for context: the 2026 paper discloses that Drewnowski sits or has sat on scientific advisory boards in the food industry, among them Nestlé, the FrieslandCampina Institute and the National Pork Board.
| # | Food (USDA) | Group | kcal per 100 g | NRF9.3 |
|---|---|---|---|---|
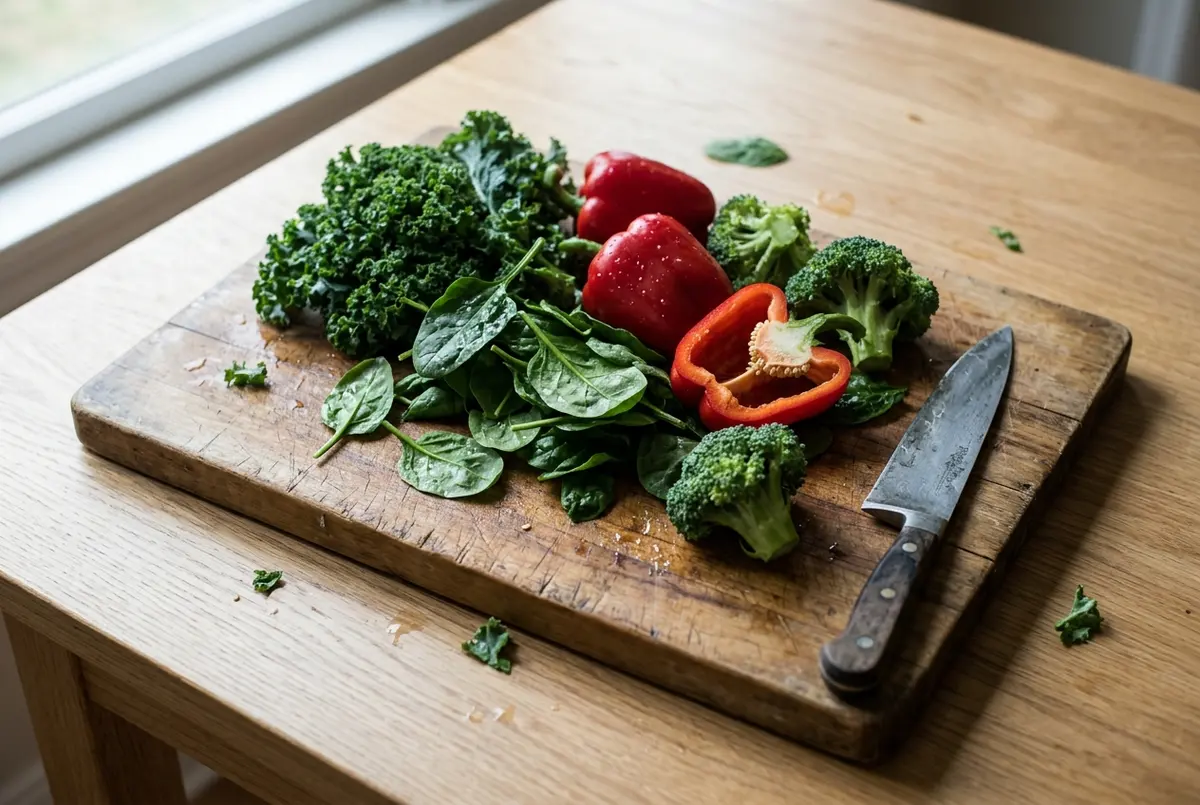
| 1 | Spinach, raw | Vegetables | 23 | 534 |
| 2 | Kale, raw | Vegetables | 35 | 363 |
| 3 | Red sweet pepper, raw | Vegetables | 26 | 282 |
| 4 | Pumpkin, raw | Vegetables | 26 | 241 |
| 5 | Brussels sprouts, raw | Vegetables | 43 | 225 |
| 6 | Broccoli, raw | Vegetables | 34 | 220 |
| 7 | Tomato, raw | Vegetables | 18 | 217 |
| 8 | Cantaloupe melon, raw | Fruit | 34 | 198 |
| 9 | White cabbage, raw | Vegetables | 25 | 197 |
| 10 | Carrots, raw | Vegetables | 41 | 182 |
| 11 | Sweet potato, baked in skin | Vegetables | 90 | 171 |
| 12 | Strawberries, raw | Fruit | 32 | 163 |
| 13 | Kiwifruit, raw | Fruit | 61 | 162 |
| 14 | Beef liver, raw | Fish, seafood and meat | 135 | 155 |
| 15 | Oranges, raw | Fruit | 47 | 148 |
| 16 | Mango, raw | Fruit | 60 | 112 |
| 17 | White mushrooms, raw | Vegetables | 22 | 107 |
| 18 | Firm tofu (calcium sulfate), raw | Pulses | 144 | 84.9 |
| 19 | Beetroot, raw | Vegetables | 43 | 78.4 |
| 20 | Edamame, frozen, prepared | Pulses | 121 | 77.7 |
Source: USDA FoodData Central, SR Legacy; NRF9.3 method and US daily values from Drewnowski & Mgaya, Foods 2026 (PMC13606528); calculation by GetCookMatch.
The top 20 is almost all vegetables and fruit, so the five best vegetables and the five best fruits are already in it. The other groups only make sense compared with their own kind.
| Group | 1 | 2 | 3 | 4 | 5 |
|---|---|---|---|---|---|
| Pulses | firm tofu 84.9 | edamame 77.7 | lentils, boiled 73 | black beans, boiled 69.6 | red kidney beans, boiled 65.1 |
| Grains | quinoa, cooked 41.7 | roasted buckwheat groats, cooked 38.2 | oats, dry 33.6 | whole-wheat bread 32.3 | pearled barley, cooked 26.8 |
| Fish, seafood and meat | beef liver, raw 155 | Atlantic cod, raw 72 | light tuna in water, canned 59.1 | sardines in oil with bones, canned 52.3 | pork tenderloin, roasted 46.9 |
| Eggs and dairy | Greek yogurt, nonfat, plain 55.7 | egg, raw 33.5 | cottage cheese 2% 29 | whole milk 3.25%, vitamin D added 24.2 | Greek yogurt, whole milk, plain 18.7 |
| Nuts and seeds | sunflower seed kernels 70.6 | chia seeds 66.6 | almonds 62.2 | flaxseed 52.3 | pumpkin seed kernels 47.5 |
Source: USDA FoodData Central, SR Legacy; NRF9.3 per 100 kcal, calculation by GetCookMatch.
And the bottom of the list, for contrast. A negative score means the food carries more of the three nutrients to limit than of the nine to encourage.
| Food (USDA) | kcal per 100 g | NRF9.3 |
|---|---|---|
| Cola, sweetened | 42 | -46.9 |
| Hard candies | 394 | -31.7 |
| Italian pork salami | 425 | -20 |
| Bologna, beef and pork | 308 | -12.7 |
| Glazed yeast doughnut, enriched | 421 | -11.4 |
Source: USDA FoodData Central, SR Legacy; NRF9.3 per 100 kcal, calculation by GetCookMatch.
Which vitamins do you need, and where do you find them?
Vitamins split into two families. Vitamins A, D, E and K are fat-soluble. NIH says vitamin E needs fat to be absorbed, that fat in the gut improves absorption of vitamin D (though some is absorbed without it), and that eating vegetables with fat improves absorption of vitamin K. So a dressing on a spinach salad is doing a job. The water-soluble vitamins, C and the B group, are the ones cooking takes away: in the USDA table below, greens boiled in plenty of water keep only 55% of their vitamin C and 60% of their folate. That matters more in the kitchen than any supplement shelf, and we come back to it below.
The table lists the EU nutrient reference value (NRV), the figure behind the percentages on EU labels, and the everyday foods with the most of each vitamin per 100 g. We picked foods home cooks actually buy, such as parsley, seeds and oily fish, and left liver (beef and chicken), mackerel and UV-treated mushrooms out of the vitamin columns; liver and mushrooms come up separately below. Remember that dry foods and herbs look bigger per 100 g than they are per serving.
| Vitamin | What it does (NIH) | EU NRV per day | Everyday sources, per 100 g (% EU NRV) |
|---|---|---|---|
| A | immune function, growth, reproduction; vision | 800 µg | sweet potato, baked 961 µg RAE (120%); carrots, raw 835 µg (104%); spinach, raw 469 µg (59%) |
| B1 (thiamin) | energy metabolism, growth and cell function | 1.1 mg | flaxseed 1.64 mg (149%); sunflower seed kernels 1.48 mg (135%); pork tenderloin, roasted 0.95 mg (86%) |
| B2 (riboflavin) | energy metabolism, cell growth, fat metabolism | 1.4 mg | almonds 1.14 mg (81%); feta 0.844 mg (60%); egg 0.457 mg (33%) |
| B3 (niacin) | becomes NAD, used by more than 400 enzymes to get energy from food | 16 mg | chicken breast, roasted 13.7 mg (86%); peanuts, raw 12.1 mg (75%); light tuna in water, canned 10.1 mg (63%) |
| B6 | more than 100 enzyme reactions, mostly protein metabolism | 1.4 mg | sunflower seed kernels 1.34 mg (96%); pork tenderloin, roasted 0.739 mg (53%); farmed salmon, cooked 0.647 mg (46%) |
| Folate (B9) | making DNA and RNA, amino acid metabolism | 200 µg | edamame 311 µg (156%); peanuts 240 µg (120%); spinach, raw 194 µg (97%); lentils, boiled 181 µg (90%) |
| B12 | nervous system, red blood cells, DNA | 2.5 µg | clams, cooked 98.9 µg (3,956%); Atlantic herring, raw 13.7 µg (547%); sardines in oil, canned 8.94 µg (358%) |
| C | collagen, L-carnitine and some neurotransmitters; antioxidant | 80 mg | parsley 133 mg (166%); red sweet pepper, raw 128 mg (160%); kale, raw 93.4 mg (117%); broccoli, raw 89.2 mg (112%) |
| D | calcium absorption, normal bone mineralization | 5 µg | farmed rainbow trout, raw 15.9 µg (318%); farmed salmon, cooked 13.1 µg (262%); sardines in oil, canned 4.8 µg (96%) |
| E | antioxidant (alpha-tocopherol) | 12 mg | sunflower oil 41.1 mg (342%); sunflower seed kernels 35.2 mg (293%); almonds 25.6 mg (214%); olive oil 14.3 mg (120%) |
| K | blood clotting proteins, bone metabolism | 75 µg | parsley 1,640 µg (2,187%); spinach, raw 483 µg (644%); kale, raw 390 µg (519%); broccoli, raw 102 µg (135%) |
Source: NIH Office of Dietary Supplements fact sheets; USDA FoodData Central, SR Legacy; EU NRV, Regulation 1169/2011, Annex XIII Part A.
A few of these need a sentence of context. Vitamin A from animal foods is preformed vitamin A. In plants it comes as beta-carotene and related pigments, which is why carrots and sweet potato top the list. Liver is in a different league: raw beef liver has 4,968 µg RAE per 100 g and raw chicken liver 3,296 µg. Both are above the 3,000 µg daily upper limit that NIH gives for adults, and that limit covers only preformed vitamin A from animal foods and supplements, not beta-carotene. That is why we treat liver as an occasional food.
B12 occurs naturally only in animal foods, NIH says, so vegans need another source (more on that below). Vitamin D is hard to get from food at all. NIH writes that it is difficult to get enough from foods that are not fortified, and in our list the leaders are oily fish. Mushrooms exposed to ultraviolet light are the exception: USDA lists 28.4 µg per 100 g for UV-treated raw portobello, but that number does not apply to ordinary mushrooms.
The kiwi, a classic of "vitamin C" lists, is a useful warning about databases. USDA's older SR Legacy data gives green kiwi 92.7 mg of vitamin C per 100 g. USDA's newer Foundation data, measured on 8 samples, gives 58.8 mg. Both come from the same agency, so "about 60 to 90 mg" is the honest answer.
Which minerals matter, and which foods are richest in iron?
Minerals survive cooking much better than vitamins: in the USDA retention table, calcium, iron and magnesium keep 95 to 100%, and potassium 85 to 100%. The bigger issue is how much the body absorbs, and that matters more than the raw numbers.
| Mineral | What it does (NIH) | EU NRV per day | Everyday sources, per 100 g (% EU NRV) |
|---|---|---|---|
| Calcium | bones and teeth; muscles, blood clotting, nerve signals | 800 mg | parmesan 1,184 mg (148%); cheddar 710 mg (89%); firm tofu (calcium sulfate) 683 mg (85%); feta 493 mg (62%) |
| Iron | haemoglobin and myoglobin carry oxygen; growth and neurological development | 14 mg | chicken liver, raw 8.99 mg (64%); pumpkin seed kernels 8.82 mg (63%); chia seeds 7.72 mg (55%); parsley 6.2 mg (44%); lentils, boiled 3.33 mg (24%) |
| Magnesium | cofactor for more than 300 enzyme systems | 375 mg | pumpkin seed kernels 592 mg (158%); flaxseed 392 mg (105%); chia seeds 335 mg (89%); sunflower seed kernels 325 mg (87%) |
| Potassium | fluid balance inside cells, electrical charge of cell membranes | 2,000 mg | flaxseed 813 mg (41%); pumpkin seed kernels 809 mg (40%); almonds 733 mg (37%); sweet potato, baked 475 mg (24%) |
| Zinc | hundreds of enzymes; immune function, protein and DNA, wound healing, taste | 10 mg | oysters, raw 39.3 mg (393%); pumpkin seed kernels 7.81 mg (78%); beef patty 85/15, broiled 6.31 mg (63%); cashews 5.78 mg (58%) |
| Selenium | 25 selenoproteins: thyroid hormones, DNA, protection from oxidative damage | 55 µg | Brazil nuts 1,917 µg (3,485%); light tuna in water, canned 70.6 µg (128%); clams, cooked 64 µg (116%); chicken liver, raw 54.6 µg (99%) |
| Iodine | thyroid hormones T4 and T3 | 150 µg | see per-serving table below |
Source: NIH Office of Dietary Supplements fact sheets; USDA FoodData Central, SR Legacy; EU NRV, Regulation 1169/2011, Annex XIII Part A.
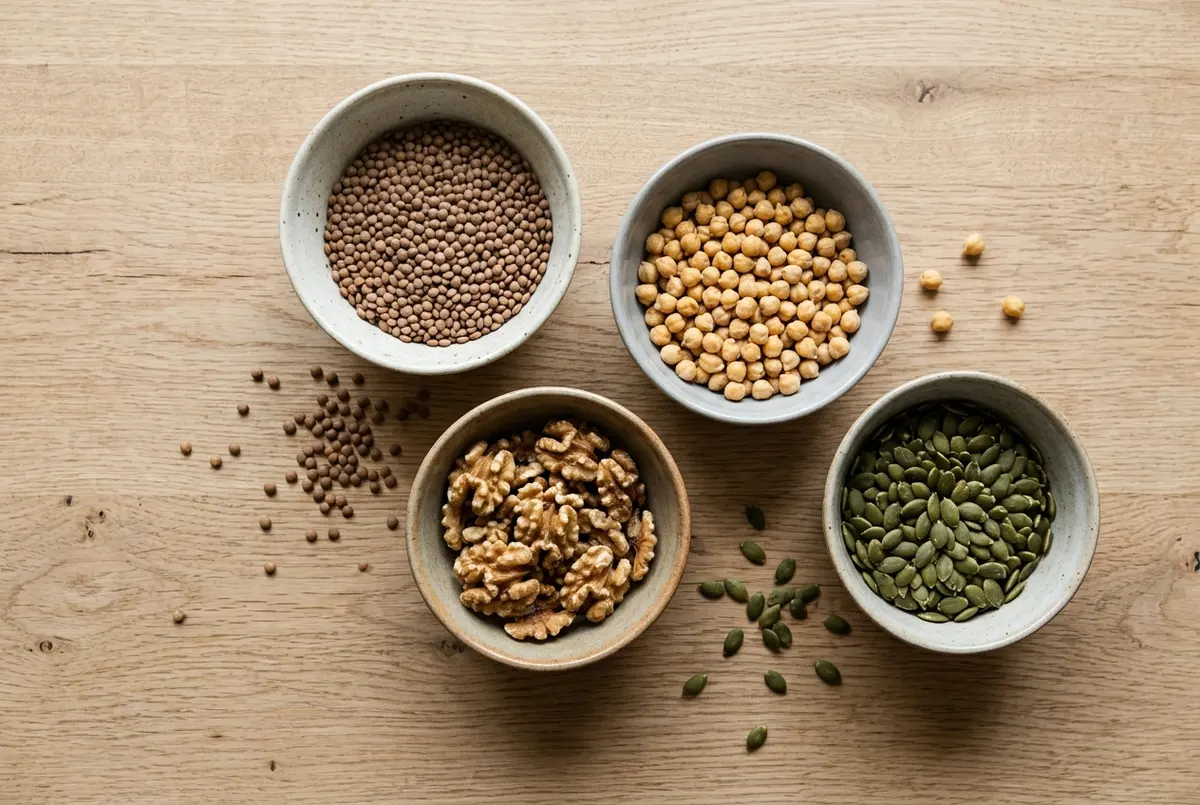
Iron comes in two forms. Haem iron is found only in meat, fish and poultry, which also contain some non-haem iron. Plants contain only non-haem iron, which the body absorbs less well. NIH puts the absorption of iron at about 14 to 18% from a mixed diet and 5 to 12% from a vegetarian one. Vitamin C helps the body take up non-haem iron, while phytates in grains and pulses reduce it. In practice that is an argument for lemon on lentils and tomatoes in a chickpea curry.
Spinach is the famous trap. It appears on calcium lists, but NIH says the body absorbs only about 5% of the calcium in spinach, against 27% from milk, because spinach is high in oxalic acid. Calcium from broccoli, kale and cabbage is absorbed about as well as from milk.
Brazil nuts show why "the most" is not always better. USDA gives 1,917 µg of selenium per 100 g, and one nut weighs about 5 g, which works out to roughly 96 µg per nut (our calculation from USDA data). Three nuts come to about 288 µg, above the 255 µg daily upper limit EFSA set in 2023, and four come to about 383 µg, close to the 400 µg limit used in the US.
Iodine is almost absent from the USDA database we used, so NIH figures are given here per serving, not per 100 g.
| Food and serving (NIH) | Iodine per serving |
|---|---|
| Cod, baked, 3 oz (85 g) | 146 µg |
| Nori, dried, 2 tbsp flakes (5 g) | 116 µg |
| Oysters, cooked, 3 oz | 93 µg |
| Greek yogurt, plain, nonfat, ¾ cup | 87 µg |
| Skim milk, 1 cup | 84 µg |
| Iodized salt, ¼ tsp | 78 µg |
| Egg, boiled, 1 large | 31 µg |
| Shrimp, cooked, 3 oz | 13 µg |
| Broccoli, boiled, ½ cup | 0 µg |
| Sea salt, not iodized, ¼ tsp | 0 µg |
Source: NIH Office of Dietary Supplements, Iodine fact sheet, Table 2.
Then there is salt, the one mineral most people get too much of. The EU label reference is 6 g of salt a day, which is 2.4 g of sodium, since the regulation counts salt as sodium × 2.5. The WHO goes lower, under 5 g. The WHO names ready meals and processed meat, bread, stock cubes, soy sauce and fish sauce as the main sources, and the USDA numbers agree.
| Food (USDA) | Sodium per 100 g |
|---|---|
| Soy sauce (shoyu) | 5,493 mg |
| Italian pork salami | 1,890 mg |
| Parmesan | 1,175 mg |
| Feta | 1,139 mg |
| Bologna, beef and pork | 960 mg |
| Potato chips, salted | 527 mg |
| White bread, commercial | 490 mg |
Source: USDA FoodData Central, SR Legacy; salt conversion, Regulation 1169/2011, Annex I.
Most nutrient-dense foods: a side-by-side table
This table puts sixteen everyday foods next to each other: calories, protein and fiber, and the three micronutrients each one is strongest in, as a share of the EU NRV per 100 g.
| Food (USDA, per 100 g) | kcal | Protein, g | Fiber, g | Strongest micronutrients (% EU NRV) |
|---|---|---|---|---|
| Spinach, raw | 23 | 2.86 | 2.2 | vitamin K 644%; folate 97%; vitamin A 59% |
| Broccoli, raw | 34 | 2.82 | 2.6 | vitamin K 135%; vitamin C 112%; folate 32% |
| Kale, raw | 35 | 2.92 | 4.1 | vitamin K 519%; vitamin C 117%; calcium 32% |
| White cabbage, raw | 25 | 1.28 | 2.5 | vitamin K 101%; vitamin C 46%; folate 22% |
| Sweet potato, baked in skin | 90 | 2.01 | 3.3 | vitamin A 120%; vitamin C 25%; potassium 24% |
| Kiwifruit, raw | 61 | 1.14 | 3 | vitamin C 116%; vitamin K 54%; potassium 16% |
| Lentils, boiled | 116 | 9.02 | 7.9 | folate 90%; iron 24%; potassium 18% |
| Chickpeas, boiled | 164 | 8.86 | 7.6 | folate 86%; iron 21%; zinc 15% |
| Oats, dry, not fortified | 379 | 13.2 | 10.1 | selenium 53%; B1 42%; magnesium 37% |
| Walnuts | 654 | 15.2 | 6.7 | folate 49%; magnesium 42%; B6 38% |
| Pumpkin seed kernels | 559 | 30.2 | 6 | magnesium 158%; zinc 78%; iron 63% |
| Farmed Atlantic salmon, cooked | 206 | 22.1 | 0 | vitamin D 262%; B12 112%; selenium 75% |
| Sardines in oil with bones, canned | 208 | 24.6 | 0 | B12 358%; vitamin D 96%; selenium 96% |
| Egg, whole, raw | 143 | 12.6 | 0 | selenium 56%; vitamin D 40%; B12 36% |
| Greek yogurt, whole milk, plain | 97 | 9 | 0 | B12 30%; B2 20%; selenium 18% |
| Beef liver, raw | 135 | 20.4 | 0 | B12 2,372%; vitamin A 621%; B2 197% |
Source: USDA FoodData Central, SR Legacy; EU NRV, Regulation 1169/2011, Annex XIII.
How to cook vegetables without losing vitamins
USDA keeps a table of how much of each nutrient survives a cooking method, and it is the most practical document in this whole field. The pattern is simple. Minerals mostly stay. Vitamin C and folate are the ones that go, and they go into the water.
| Cooking method (USDA) | Vitamin C | Thiamin | Folate | Calcium | Iron | Potassium |
|---|---|---|---|---|---|---|
| Greens, boiled in plenty of water, drained | 55% | 80% | 60% | 95% | 95% | 85% |
| Greens, boiled in a little water, drained | 60% | 85% | 65% | 95% | 95% | 90% |
| Greens, boiled, cooking water used | 70% | 90% | 75% | 100% | 100% | 100% |
| Greens, stir-fried | 85% | 90% | 85% | 100% | 100% | 100% |
| Other vegetables, boiled in plenty of water | 75% | 80% | 65% | 95% | 95% | 90% |
| Other vegetables, steamed | 85% | 90% | 85% | 100% | 100% | 100% |
| Root vegetables, boiled in plenty of water | 65% | 80% | 65% | 95% | 95% | 90% |
Source: USDA Table of Nutrient Retention Factors, Release 6 (2007). Share of the raw value that remains after cooking.
So spinach dropped into a big pot of water and drained keeps about 55% of its vitamin C. The same spinach stir-fried keeps 85%, and a vegetable such as broccoli, steamed, keeps about 85% (USDA's factor for "other vegetables"). Using less water helps a little; keeping the water, in a soup or a sauce, helps more. NIH says the same thing in fewer words: vitamin C is water-soluble and destroyed by heat, and steaming or microwaving reduces the losses. One honest footnote. The introduction of the USDA document uses "boiled greens keep 85% of vitamin C" as an example, while its own table gives 55 to 70% for boiled greens. We went with the table.
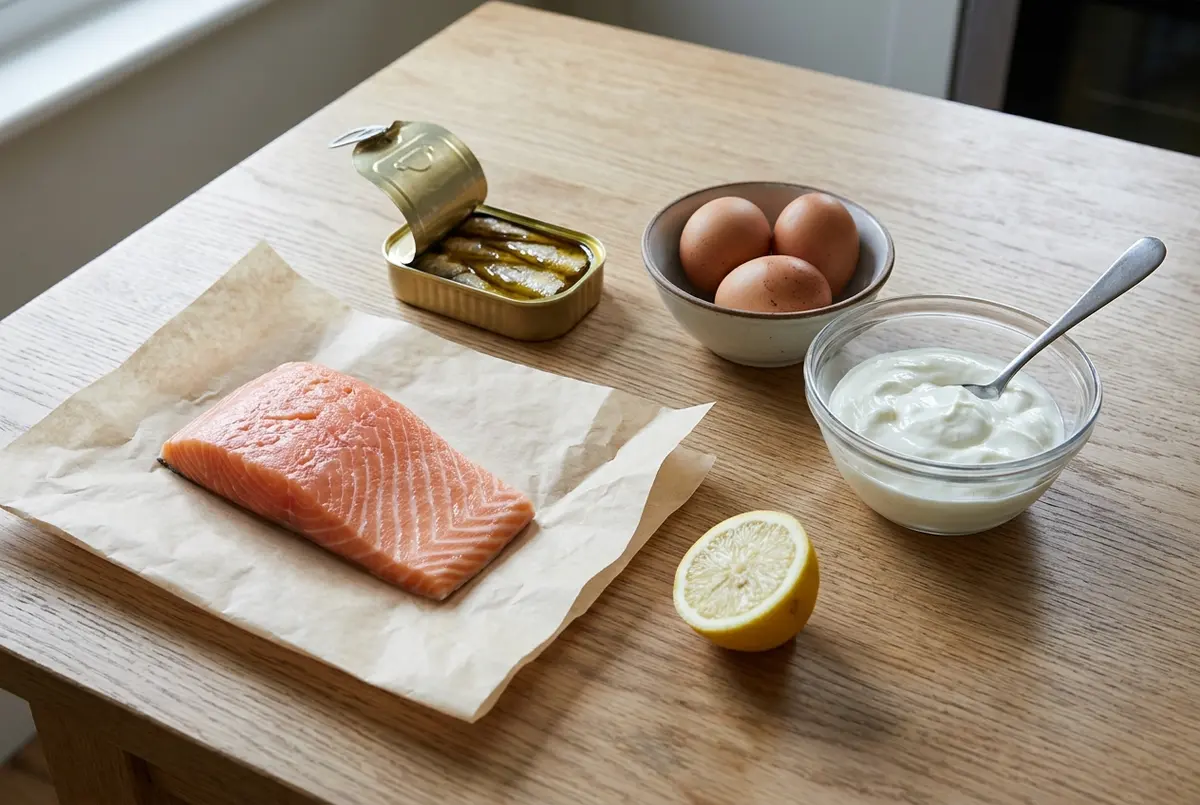
Fat is the other half of the cooking story. For vitamins E, D and K, NIH says fat in the meal helps absorption. Vitamin K from spinach is absorbed at only 4 to 17% of the rate from a tablet, and eating the vegetable with fat improves that. Olive oil on greens, or salmon with its own fat, is the kitchen version of that sentence. NIH makes no such statement about vitamin A or beta-carotene, so we will not claim that oil on carrots does the same.
Who needs to pay extra attention?
NIH singles out a few groups. If you are in one of them, ask a doctor or pharmacist which supplement, if any, you need.
Women who could become pregnant are advised to get 400 µg of folic acid a day from supplements or fortified foods, on top of the folate in their diet. During pregnancy the recommended intake rises to 600 µg DFE. Vegans and vegetarians need a reliable source of B12, because natural sources are only animal foods; NIH points to fortified foods and supplements. Older adults are at risk of low vitamin D, since their skin makes less of it and they tend to spend more time indoors, and of low B12. Pregnant women, especially those who eat no dairy, can run low on iodine, and so can vegans and anyone who eats little dairy, seafood or eggs.
For everyone, NIH says the vitamin D the skin makes depends on the season, the time of day, the length of the day, cloud cover and skin pigmentation. Two medical cautions are worth repeating. People on warfarin or similar anticoagulants should keep their vitamin K intake steady, because sudden changes alter how the drug works. And people with kidney disease or on certain medicines should be careful with potassium-based salt substitutes.
Why recommendations differ from country to country
If a number here does not match the one on a cereal box or a health website, it may not be an error. The EU label values, the US recommended intakes and the WHO guidance answer different questions. An EU label value is one number for all adults, while US recommended intakes are set separately by age and sex.
| Nutrient (per day) | EU label value | US | WHO |
|---|---|---|---|
| Vitamin D | 5 µg | RDA 15 µg (ages 19–70), 20 µg (over 70) | — |
| Vitamin C | 80 mg | RDA 90 mg (men), 75 mg (women) | — |
| Folate | 200 µg (as folic acid) | RDA 400 µg DFE; 600 µg DFE in pregnancy | — |
| Potassium | 2,000 mg | 4,700 mg (FDA label daily value) | at least 3,510 mg (may be beneficial) |
| Salt / sodium | 6 g salt (2.4 g sodium) | 2,300 mg sodium (FDA label daily value) | under 5 g salt (2 g sodium) |
| Fiber | 25 g (EFSA) | 28 g (FDA label daily value) | at least 25 g |
Source: Regulation (EU) 1169/2011; NIH Office of Dietary Supplements; FDA daily values as listed in Drewnowski & Mgaya, Foods 2026; WHO Healthy diet fact sheet, 2026.
The upper limits differ too. For vitamin B6 the US limit for adults is 100 mg a day, while EFSA set 12 mg in 2023. For selenium it is 400 µg in the US and 255 µg in EFSA's 2023 opinion.
Recipes to start with
All of these are on the site, and each one leans on a food from the tables above.
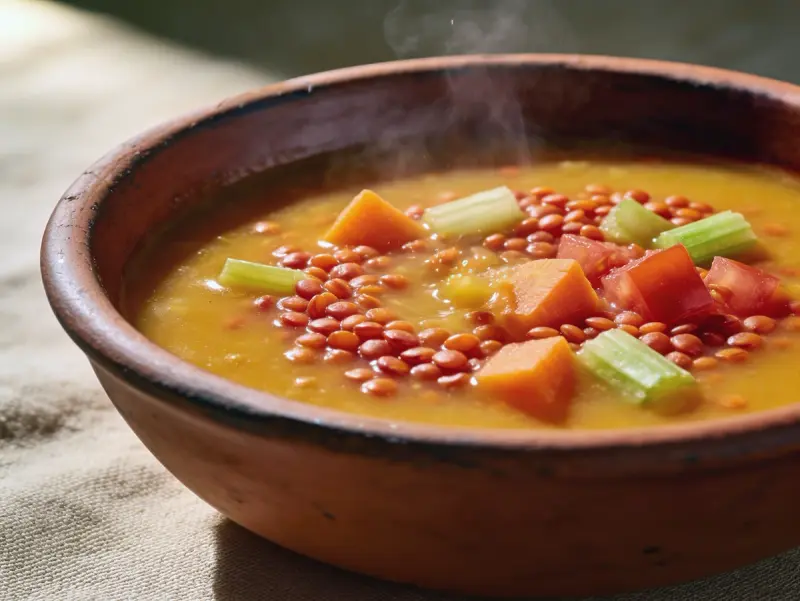
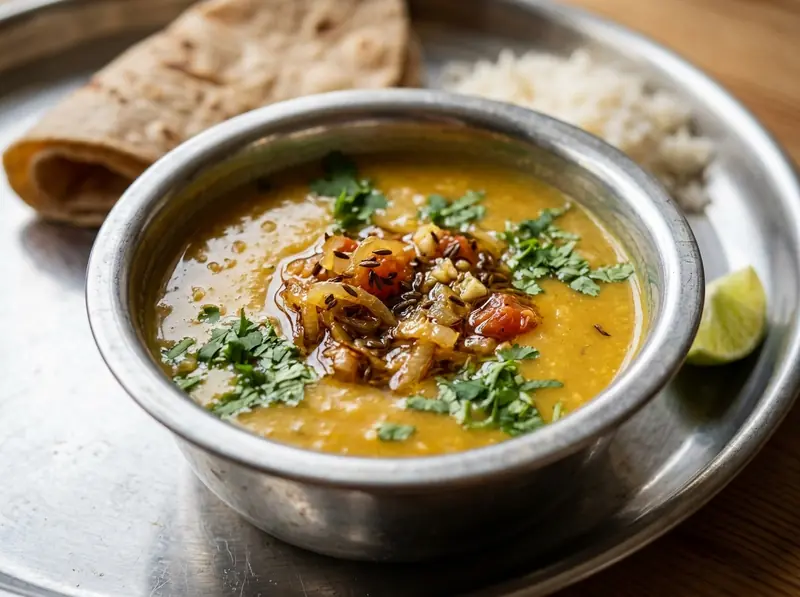
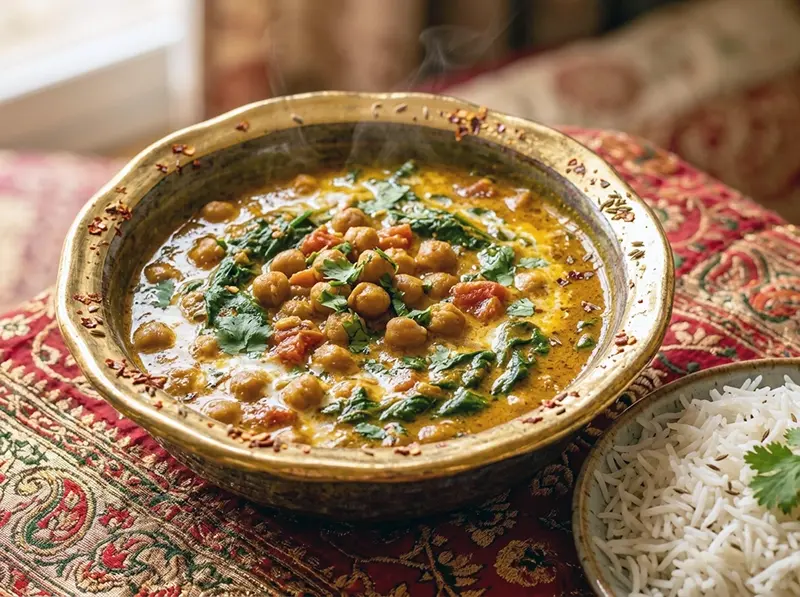
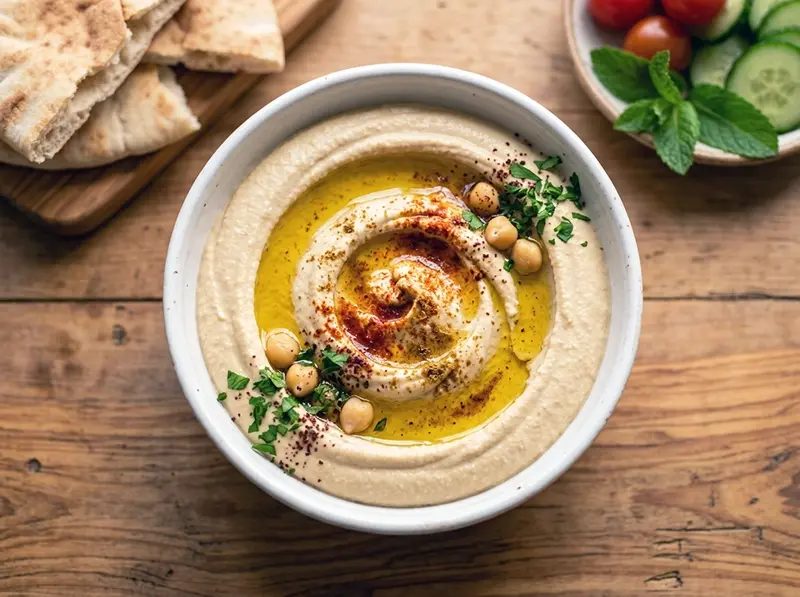
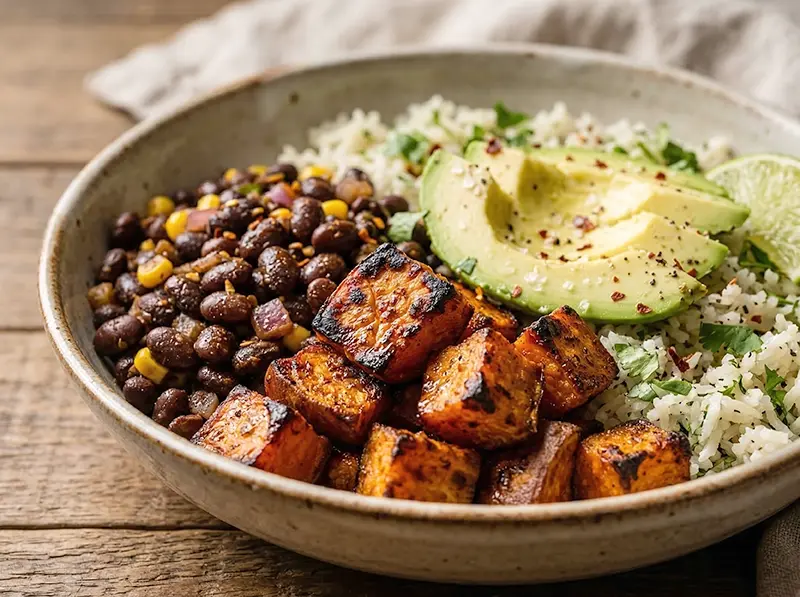
Pulses first. Lentil vegetable soup and dal soup are the easiest way to eat lentils: fiber, folate, protein and non-haem iron. Chickpea and spinach curry puts chickpeas and spinach together with tomatoes, whose vitamin C helps the iron. Hummus does the same with chickpeas and lemon juice. For vitamin A from beta-carotene, try roasted sweet potato and black bean bowls, which add fiber from the beans, or Kürbissuppe, a German pumpkin soup.
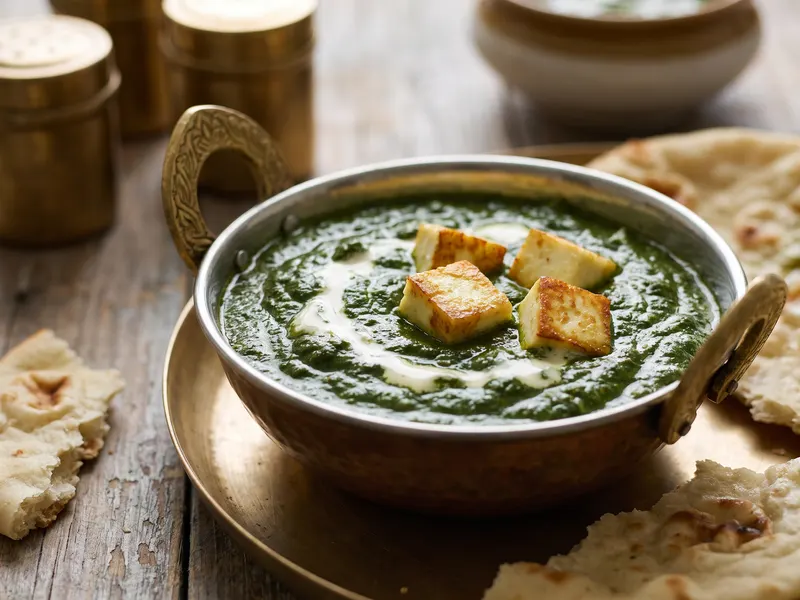
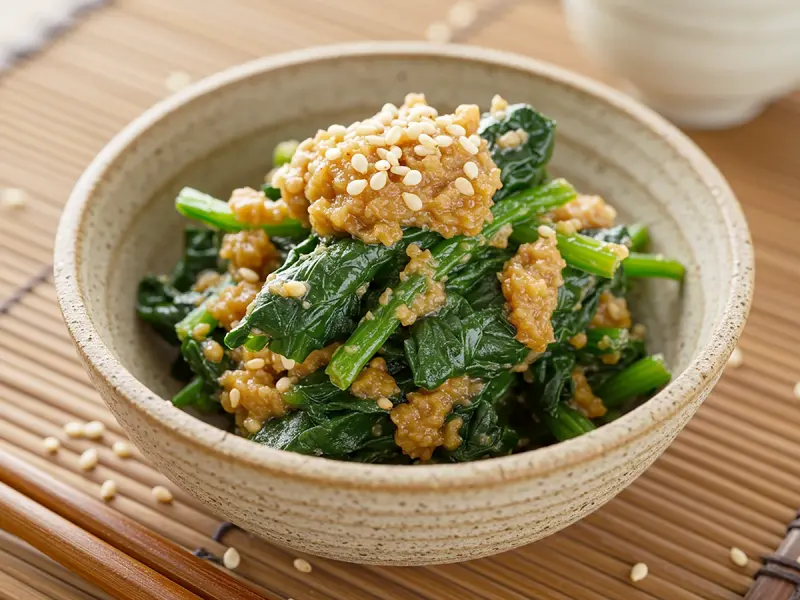
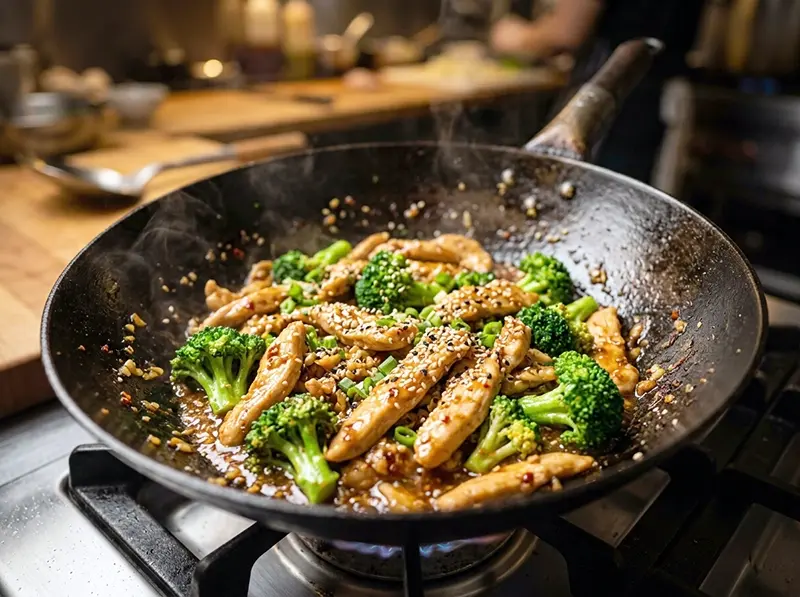
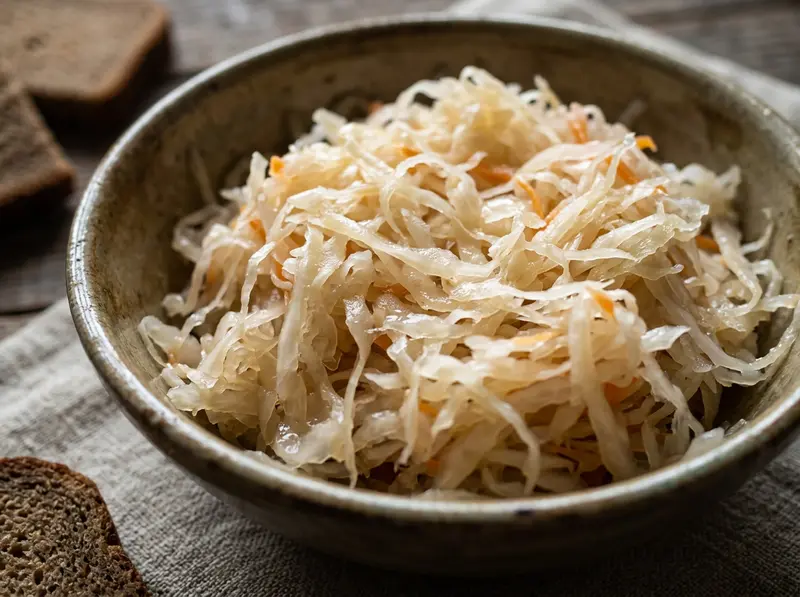
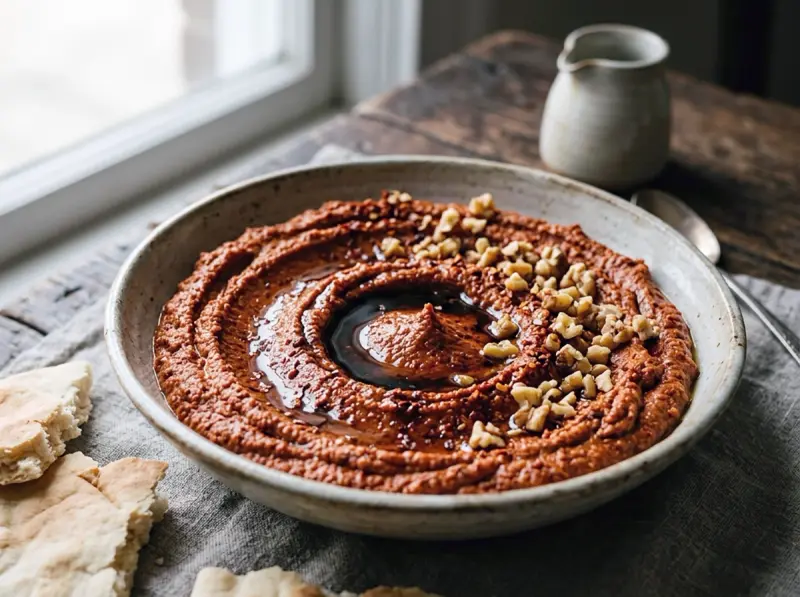
For greens, palak paneer and spinach with sesame sauce both bring vitamin K and folate. Palak paneer is also the place to remember the spinach calcium point above: only about 5% of it is absorbed. Chicken and broccoli stir-fry pairs the vitamin C and K of broccoli, blanched for only 90 seconds and then tossed in the wok, with niacin and B6 from the chicken. Kvashenaya kapusta, Russian sauerkraut, is white cabbage with its vitamin C and K, made without heat. Muhammara is built on roasted red peppers and walnuts: some of the peppers' vitamin C, and magnesium from the nuts.
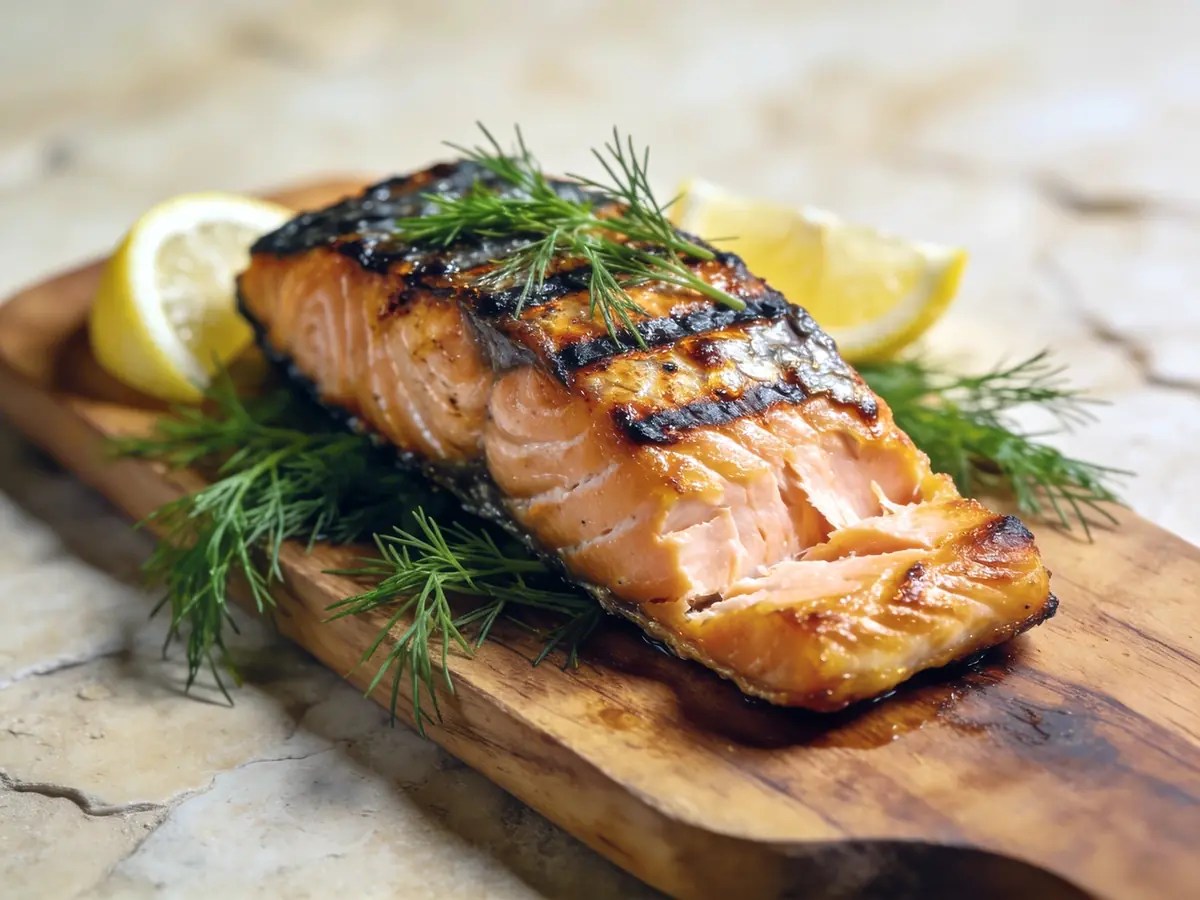
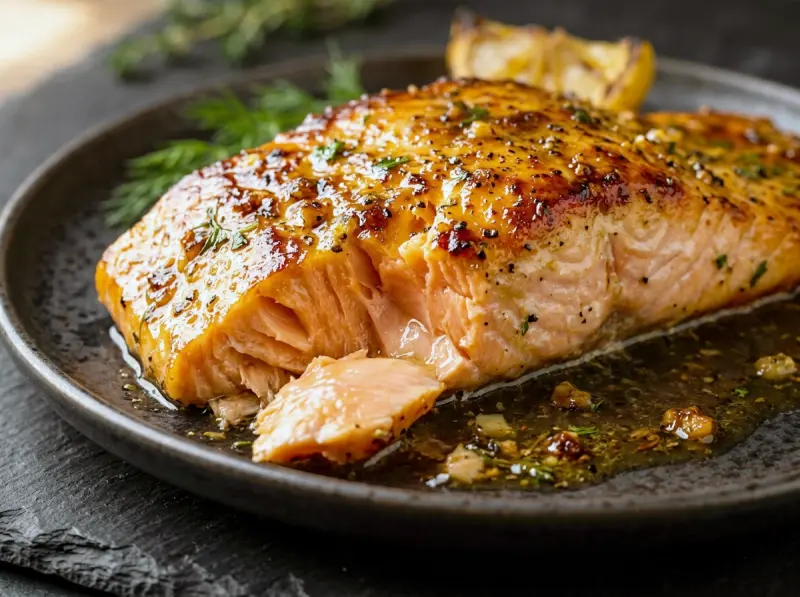
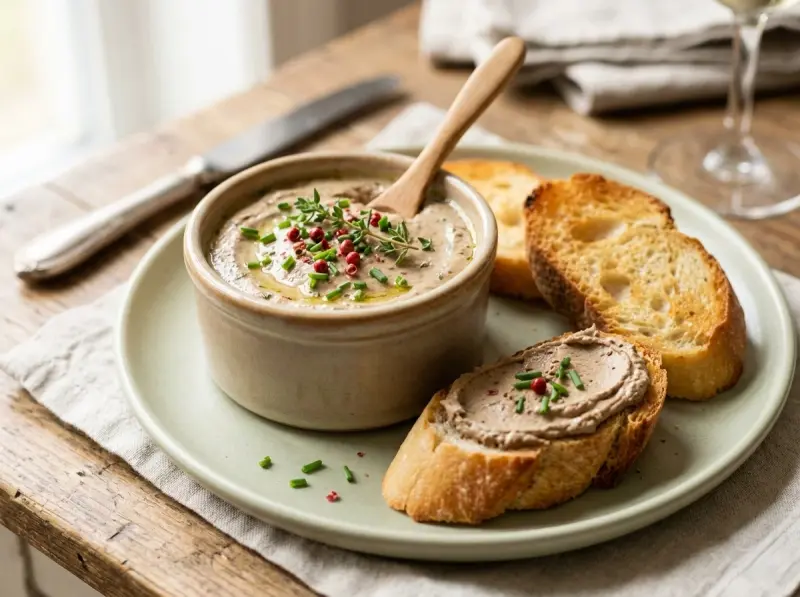
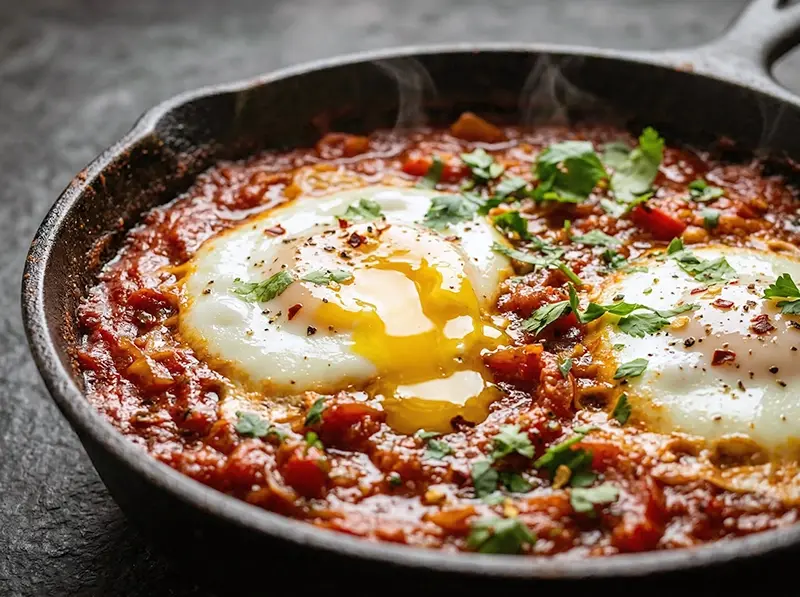
Fish and eggs cover vitamin D and B12. Grilled salmon and baked salmon are the simple way in, and shakshuka gives you eggs in tomato sauce for protein, B12 and selenium. Chicken liver pâté is the richest source of vitamin A, B12, folate and iron here, and also the reason for the liver caveat above: raw chicken liver has more preformed vitamin A per 100 g than the adult daily upper limit, so treat it as an occasional spread.
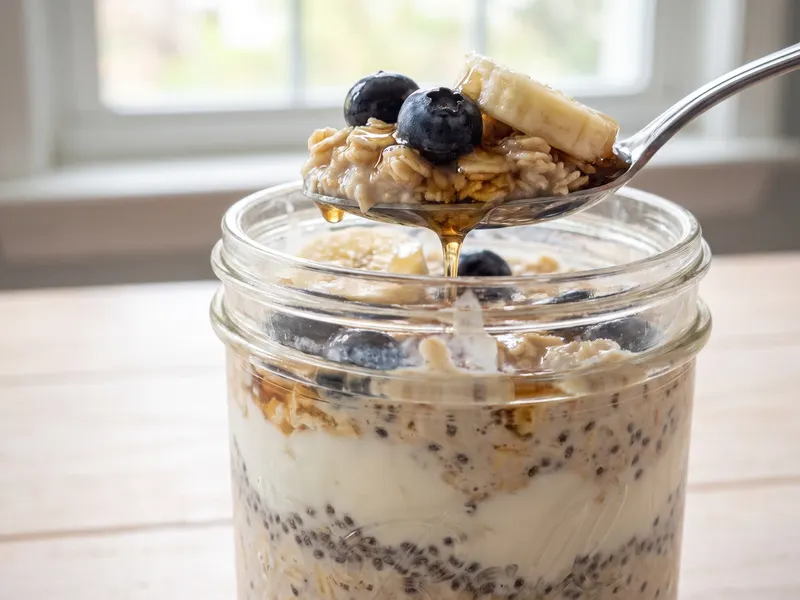
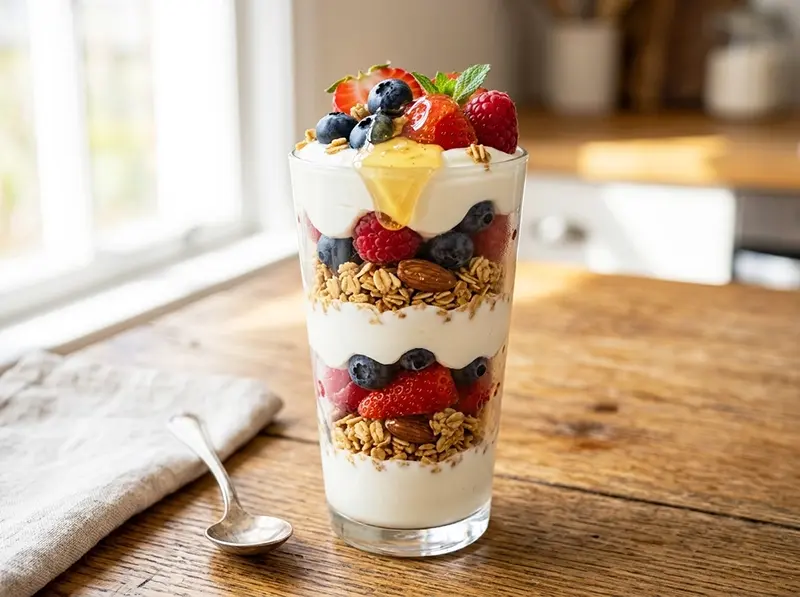
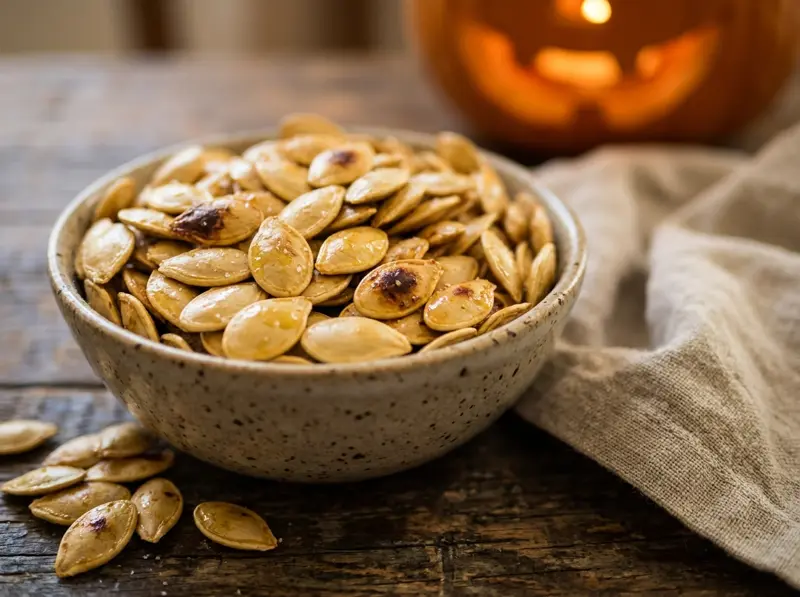
For breakfast, overnight oats combine oats, Greek yogurt and chia for fiber, magnesium and calcium, and a Greek yogurt parfait gives protein, calcium and B12. Roasted pumpkin seeds are a snack with magnesium, zinc and iron; note that the recipe uses whole seeds in the shell, while our tables list the shelled kernels.
If you want more in one direction, we have collections of high-fiber recipes and high-protein recipes.
Sources
Nutrient values per 100 g are from USDA FoodData Central (SR Legacy, the final April 2018 release), and cooking losses from the USDA Table of Nutrient Retention Factors, Release 6. Daily reference values come from Regulation (EU) No 1169/2011 on food information to consumers, Annex XIII, and from the EFSA scientific opinions on carbohydrates and dietary fiber and on water (2010). What each nutrient does, the upper limits, absorption figures, the iodine table and the groups at risk are from the Health Professional fact sheets of the NIH Office of Dietary Supplements. Dietary guidance is from the WHO Healthy diet fact sheet (January 2026) and the Healthy Eating Plate of the Harvard T.H. Chan School of Public Health. The ranking follows the NRF9.3 index of Fulgoni, Keast and Drewnowski (2009) with reference values from Drewnowski and Mgaya (Foods, 2026); the calculation is ours.
This article is general reference information, not medical advice. If you have a medical condition, are pregnant, take medication or are thinking about supplements, talk to your doctor first.